

PROBLEM SOLVING (PART THREE) DATA COLLECTION
In problem solving part one, we delved into identifying the problem and the difference between a problem and symptom. Part two worked on analysis of the problem and now we are going to start to collect data, analyze that data and identify the root cause. Parts one and two appear to be going backwards in time to ensure we are looking at a problem and not a symptom, and here we are going to start to move forward.
Now is a good time to show you what tool I am following as we can start to fill in the blanks. I introduced the A3 Problem Solving Report (Figure 1) in a previous article but didn’t go into its construction in any detail. Part one in this series allowed us to complete step one in the report and part two helped us complete steps two and three. Step one, “the problem,” is a descriptive statement of the problem and step two, “the definition,” is a one liner or very short identification of the problem that can be plugged into the “problem” block in step 4a. Step three, “the point of cause,” is the point in time where the problem originated. This is typically not the point in time where it manifested itself which is referred to as “the point of effect.” Steps one, two and three set us up to grasp the situation at hand.
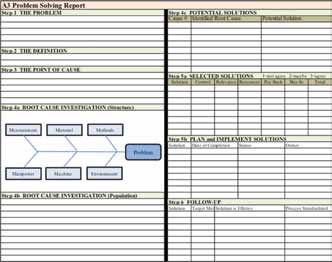
Figure 1. A3 Problem Solving Report
The rest of the steps in this process are a set of quality tools: step 4a is an Ishikawa or Fishbone diagram; step 4b is the “five why” analysis; and steps 4c to six on the right are forms of matrices, with step 5a a prioritization matrix.
Data Collection
This can be almost anything that is related to the problem or the symptom. It is better to have collected more data than what is needed then to not have enough. Data can be gathered from interviews, photos, documents, records, observation, etc. This is going to comprise the physical evidence required to make decisions based on fact. Except for interviews and observations, the evidence collected is pretty straight forward.
Books have been written on interview techniques, so I can only scratch the surface here — but keep in mind that communication is only about 20 percent verbal and 80 percent non-verbal. Pulse and body temperature are also in that 80 percent mix, but we can’t approach that area. However, we can look at other physical attributes that confirm or contradict what is being said such as tone of voice, inflection, eye movement and body language.
Although 80 percent of communication is non-verbal, you need to look at the entire conversation and not just one attribute. A person crossing his/her arms may be a defensive indication that they are putting up barriers to the conversation — it might also mean that it is a comfortable way to sit or that it’s chilly in the room. Even Sigmund Freud said, “Sometimes a cigar is just a cigar.”
Involuntary actions such as eye dilation are more telling but difficult to detect unless you are experienced. You have to learn to differentiate between eye dilation due to changes in light conditions from those induced by stress or excitement.
Mirroring is just as the name implies. The person being interviewed will mimic the actions of the person conducting the interview. Unless this is intentional it won’t be a one-for-one mirror image, but the actions are predominantly copied. Mirroring could be matching the speed and tone of voice, gestures, eye movement and even accents. When the interviewee mimics the interviewer, it is a sign of acceptance. The interviewer can intentionally mimic the interviewee to put them at ease, but it will be viewed as mockery if overdone.
Tone of voice and inflection can put a different meaning on what is said. “I didn’t steal your wallet” can be taken several ways, depending on tone and inflection. “I didn’t steal your wallet” can infer that someone else did. “I didn’t steal your wallet” can be a flat denial. “I didn’t steal your wallet” can indicate that you possess it, rather you were just holding it for the owner. “I didn’t steal your wallet” can imply that you stole another person’s wallet. “I didn’t steal your wallet” can suggest that you stole something else of his.
The chart below gives you some clues to non-verbal communication, but remember that communication is a package of information exchange that must be consumed and processed as a whole.
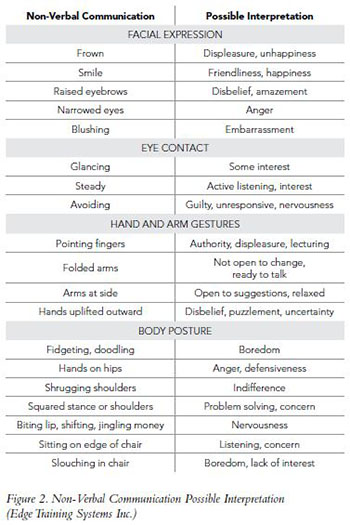
Figure 2. Non-Verbal Communication Possible Interpretation (Edge Training Systems Inc.)
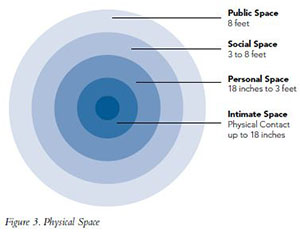
We also have to be aware of physical space when interviewing (Figure 3). This is somewhat variable depending on the culture. For Americans, we should not infringe into personal space. When interviewing you must maintain a social atmosphere and remain within three- to eight-foot zone. Get closer and you risk inducing an uncomfortable situation and emphasis will be on the uneasiness of the situation than the issue at hand. Stay too far away and you lose the degree of intimacy required to collect data, plus you are typically out of conversational speaking range.
Data Analysis
Once you have collected the data (evidence), put it on colored sticky notes (such as blue) and put them on a white board. Draw the Fishbone on the white board with the problem at the head to the right and the six primary categories: measurement, methods, materials, manpower, machine and environment, forming the main structure of the body. These primary categories are typical but you can construct any that you see fit. Proceed through each of the primary categories by brainstorming possible causes. Write them down on another color sticky note, (such as yellow) and put it under the primary category. Also include any evidential data sticky note that supports an identified cause or belongs in a category. The 5W2H method is a brainstorming stimulus tool that helps to refine this process and forces you to look at all aspects of the situation. The 5W2H asks who, what, when, where, why, how and how much for each identified cause to ensure you have drilled down far enough.
This process sounds worse than what it really is. The use of a white board and sticky notes aids in moving things around easier. The differently-colored sticky notes allow you to visualize the evidence from the brainstormed causes.
Root Cause Identification
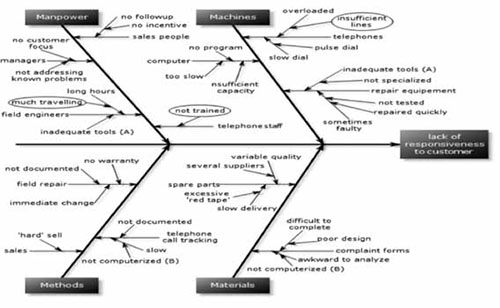
Once you have populated the Fishbone, you might have an unrecognizable mess on your hands that provides no direction. What do you do with a Fishbone diagram like the one in Figure Four? This is not science as much as it is experimentation. You may not get it right the first time and that’s normal. When a reporter asked Thomas Edison about the 10,000 failures before inventing the light bulb, Edison replied, “I didn’t have 10,000 failures; I found 10,000 ways of not building a light bulb.” Always keep your data and the process you followed because you may have to revisit this analysis. A lot of causes have been identified and begin with going back to brainstorming again. This time, ask what the important causes are. Try to identify causes that will deliver the biggest bang for the buck and take the sticky note and put it aside on the white board. For each sticky note cause, use the “five whys” tool to find the root cause. Ask “why, why, why, why, why” or until your answer no longer is related to the problem. The “five why” is a rule of thumb, as it may take less than five whys or more. Branching is also not unusual and you will have to pursue the “five whys” in each branch.
• Why wasn’t the telephone staff trained? There is no course available
• Why is there no course available? There is no one to produce it.
• Why is there no one to produce it? No one is skilled enough to develop the training.
• Why is no one skilled? Lack of experience on staff.
• Why is there a lack of experience on staff? All employees are new.
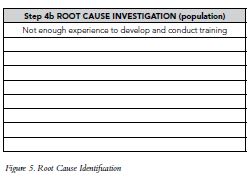
We have gone through the “five whys,” but as you see, the fifth answer is not adding any value to the process. We have identified a root cause to the training issue in the fourth iteration, not enough experience to develop and conduct training. List this in Step4b, Figure Five . Do this for each of the sticky note causes that were pulled from the Fishbone.
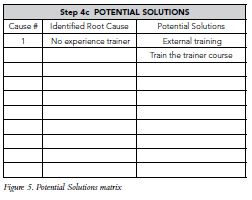
For each root cause identified in Step 4b include it in Step4c POTENTIAL SOLUTIONS, Figure Six. This may seem redundant, but you may have a solution that will affect several root causes and vice versa.
Three things must be considered once the root cause has been identified. Are they serial causes in which case fixing the identified root cause will have an effect, positive or negative, on other causes? Is it a blended cause where you cannot separate the identified root cause from other causes and they must be looked at as a group? Or is it a solo cause? However, no cause is completely independent, as all processes within an organization are linked. From here we can decide on potential solutions to the identified root causes. These may not be the actual solution implemented only possibilities. In subsequent steps we will refine this analysis and prioritize our activities.
Taxonomy of Problem Solving
1. A problem
2. Analyze the problem
3. Data collection
4. Data analysis
5. Root cause/s identification
6. Analyze solutions
7. Root cause/s elimination
8. Solution implementation/prevention
9. Monitor activities
10. Institutionalize the result.
We identified the problem in Part One and went backwards and analyzed the problem in Part Two. Here in Part Three, we moved forward to collect evidential data, analyze the circumstances and identify root causes, and came up with some possible solutions. Next in Part Four, we will look into analyzing the solutions, root cause elimination, implementing the solutions, preventing their recurrence and then cementing them in the culture.
 Patrick Kinane joined the Air Force after high school and has worked in aviation since 1964. Kinane is a certified A&P with Inspection Authorization and also holds an FAA license and commercial pilot certificate with instrument rating. He earned a bacherlor of science degree in aviation maintenance management, MBA in quantitative methods, Master of Science degree in education and Ph.D. in organizational psychology. The majority of his aviation career has been involved with 121 carriers where he has held positions from aircraft mechanic to director of maintenance. Kinane currently works as Senior Quality Systems Auditor for AAR Corp. and adjunct professor for DeVry University instructing in organizational behavior, total quality management (TQM) and critical thinking. PlaneQA is his consulting company that specializes in quality and safety system audits and training. Speaking engagements are available with subjects in critical thinking, quality systems and organizational behavior. For more information, visit www.PlaneQA.com.