

Problem Solving (Part 2) – Analysis
In part one, I delved into identifying the problem and the difference between a problem and symptom. Here we will look into the analysis portion. There are several analyses involved in the problem-solving taxonomy. We analyze the problem, we analyze the potential solutions, we analyze the implementation of the solutions, we analyze if the implemented solutions met or exceeded our original plan, we analyze when improvements are noticed and no solution has been applied, and we analyze what we can do better (including the problem-solving approach itself). Problem solving involves a lot of analysis but here we are only going to look at analyzing the problem.
 We know we have a problem, so why do we need to analyze it? The first reason is to determine how deep you need to go into problem solving. Every problem needs root-cause analysis, but you don’t want to do a full-blown problem-solving process for every problem event. If someone spills a cup of coffee, you don’t make an organizational announcement of “cleanup, aisle five,” call out the hazmat crew, quarantine the area and foam the runway. That’s overly reactive. Conversely, if someone spills acid on their person, you don’t just tell them, “go get cleaned up” and leave it at that. That’s underly reactive. I am sure you can recognize when you need a deeper root-cause analysis and when a cursory root cause would suffice in those scenarios, but there is a lot of gray inbetween.
What do we do?
Can you leave it up to management to determine how extensively to investigate? Definitely maybe. Problem solving and the accompanying root-cause analysis requires valuable resources, so you want to be conservative (but not to the extent of jeopardizing an equally-valuable improvement activity). Improvement is the primary reason for going through this process. It’s not to find the bad guy and it’s not to check a box and move on — it’s to actually change things for the better. The goal is to make your work environment safer, more efficient and more effective. You are more cost effective when you are safer, and you are more productive when you are more effective and efficient. The benefit is that the employees are more satisfied in their jobs and the customer is more satisfied in the product or service provided. Employees are more engaged when they are more satisfied in their jobs. When they are more engaged, they are more apt to contribute to improvement which leads back into the continuous improvement cycle.
The risk matrix
There has to be some mechanism to give management leeway to direct them when a thorough root-cause analysis is mandatory, optional but advisable, optional but discretionary, or not obligatory. One method that I have found useful is the risk matrix. For the reasons stated above, a problem can be a safety issue, quality issue, production issue, etc. What is your organization’s pain tolerance? Is a technician jamming his or her finger on a machine acceptable? What about if the technician jams two fingers? How about two technicians jamming their fingers? How about two in one month? What about two in one day? What if it’s the same technician, same machine, or same shift? What if it’s different technicians, different machines, or different shifts?
In order to construct a risk matrix, your organization will have to establish criteria for determining what level of response should be taken. You cannot possibly determine all the different situations that might occur in an organization, so there has to be some universally-generic description. Every organization’s concern or reason for being in business is to be productive and to generate a profit. It impacts the organization when an incident affects the production/service process. The extent of that impact should be your guiding light in determining depth of analysis.
Are we more concerned over a technician who has jammed his or her finger or cut it off on a piece of machinery? Obviously, the finger loss. Are we more concerned when one or two technicians jammed their fingers in a piece of machinery? Two technicians. Are we more concerned if the technicians jammed their finger in the past five years or past five hours? The past five hours, of course. Are we more concerned if five technicians jammed their fingers on one piece of machinery or five different pieces of machinery? The organizational impact is the five technicians jamming their fingers, so we are equally concerned with both scenarios. The information on one piece of machinery or five different machines is incidental to assist you in your path towards a solution. We have identified three criteria: the severity of the occurrence, the frequency of occurrences and the duration of occurrences.
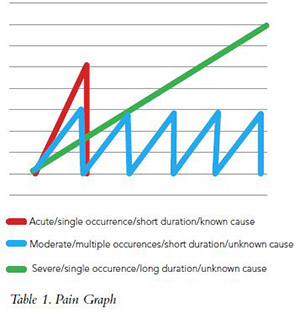
Looking at this from a pain perspective, many of us have had terribly painful headaches. Our concern goes from not worried, such as an ice cream headache because we know the cause and also know it will only last a few seconds (see the red line in Table 1 below). However, we become more alarmed if the pain is of a longer duration, such as the green line in Table 1. The longer the duration, the more alarmed we are — or the pain continues to come back, as in the blue line in Table One. We will be more concerned the more frequent the pain returns.
There is also the puzzling factor when the causes are unknown. If we experience an acute headache (as in the red line) of unknown origins, we could be alarmed enough to investigate further and not leave it alone. Is this an early sign of something else or a one-shot deal? We are left with an option to explore further or leave it alone. In the case of the recurring headache (the blue line), we may determine that the severity is at a tolerable level. A cause has been determined but possible medications would be more adverse than enduring the pain, so we decide to live with this level. However, we monitor the level and if the frequency or severity increases we would seek medication. Again, we are left with an option but we are cautious and have set a circuit breaker — if exceeded, the option to continue “as is” will be removed. The green line has exceeded tolerable conditions and there is no option but to seek medical attention.
The severity level matrix
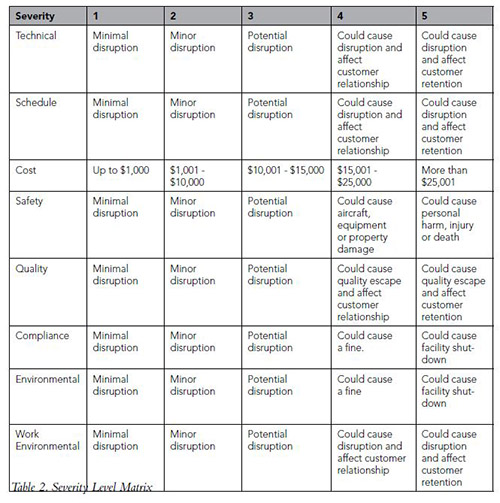
How do we get this into something we can use in our organization? First, let’s look at graphically-determining severity. Table 2 (above), the severity level matrix, is just a suggestion; you must create your own matrix that is unique to your business. For example, the severity cost criteria will be different for a small organization as compared to a multi-million-dollar organization. You might not need all the criteria and may want to add others such as supplier selection, vendor risk or delivery time. What is critical to your business? That question needs to be asked frequently as the business environment changes continually.
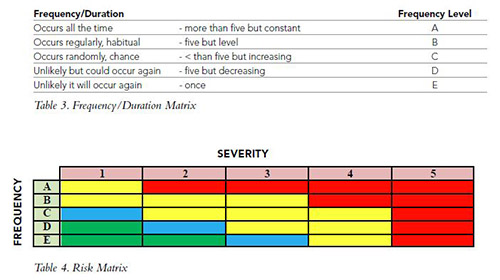
Once you have determined how much pain you are willing to endure, the next step is to determine how often or how long you are willing to endure it. Table 3 on the opposite page includes both the probability of reoccurrence and the duration of occurrence. Note that in duration, we are concerned with a threshold number (in this case five) and the direction of the trend. A number between five and seven occurrences is required to determine a trend. This prevents you from overreacting and treating common causes as special cause events. You will monitor after a solution has been implemented to ensure that the trend is going in the right direction and continue to monitor until it drops within acceptable levels. You will investigate if the trend is decreasing and no solution had been implemented. You want to find out why because improvements don’t happen accidentally.
When you add it all together you get the risk matrix graph (Table 4). Reading this is relatively simple. The manager/owner of the issue can perform a thorough investigation at any level in the risk matrix but it’s mandatory in the red area, as that is termed unacceptable. The yellow, blue and green areas are where the manager can utilize his/her discretion on how deeply to analyze the issue. In the yellow area, it would be advisable to investigate further. Blue is discretionary and green isn’t obligatory but still needs to be monitored.
We have analyzed the problem, can stick it in a graph and investige everything in red and ignore the rest, right? Wrong. This is a prioritization matrix; (improvement matrix, whatever). If you don’t have anything in red, that’s great — now you can concentrate on the items in yellow, blue and green. You continuously refine the system.
Taxonomy of problem solving:
1. Problem identification
2. Problem analysis
3. Data collection
4. Data analysis
5. Root cause(s) identification
6. Solution analysis
7. Root cause(s) elimination
8. Solution implementation/prevention
9. Activities monitoring
10. Institutionalize the result
We identified the problem in part one and went backwards and analyzed the problem here in part two. Next, in part three, we will move forward again and get into data collection, data analysis, and root cause identification.
 Patrick Kinane joined the Air Force after high school and has worked in aviation since 1964. Kinane is a certified A&P with Inspection Authorization and also holds an FAA license and commercial pilot certificate with instrument rating. He earned a bacherlor of science degree in aviation maintenance management, MBA in quantitative methods, Master of Science degree in education and Ph.D. in organizational psychology. The majority of his aviation career has been involved with 121 carriers where he has held positions from aircraft mechanic to director of maintenance. Kinane currently works as Senior Quality Systems Auditor for AAR Corp. and adjunct professor for DeVry University instructing in organizational behavior, total quality management (TQM) and critical thinking. PlaneQA is his consulting company that specializes in quality and safety system audits and training. Speaking engagements are available with subjects in critical thinking, quality systems and organizational behavior. For more information, visit www.PlaneQA.com.